

The transactions screen
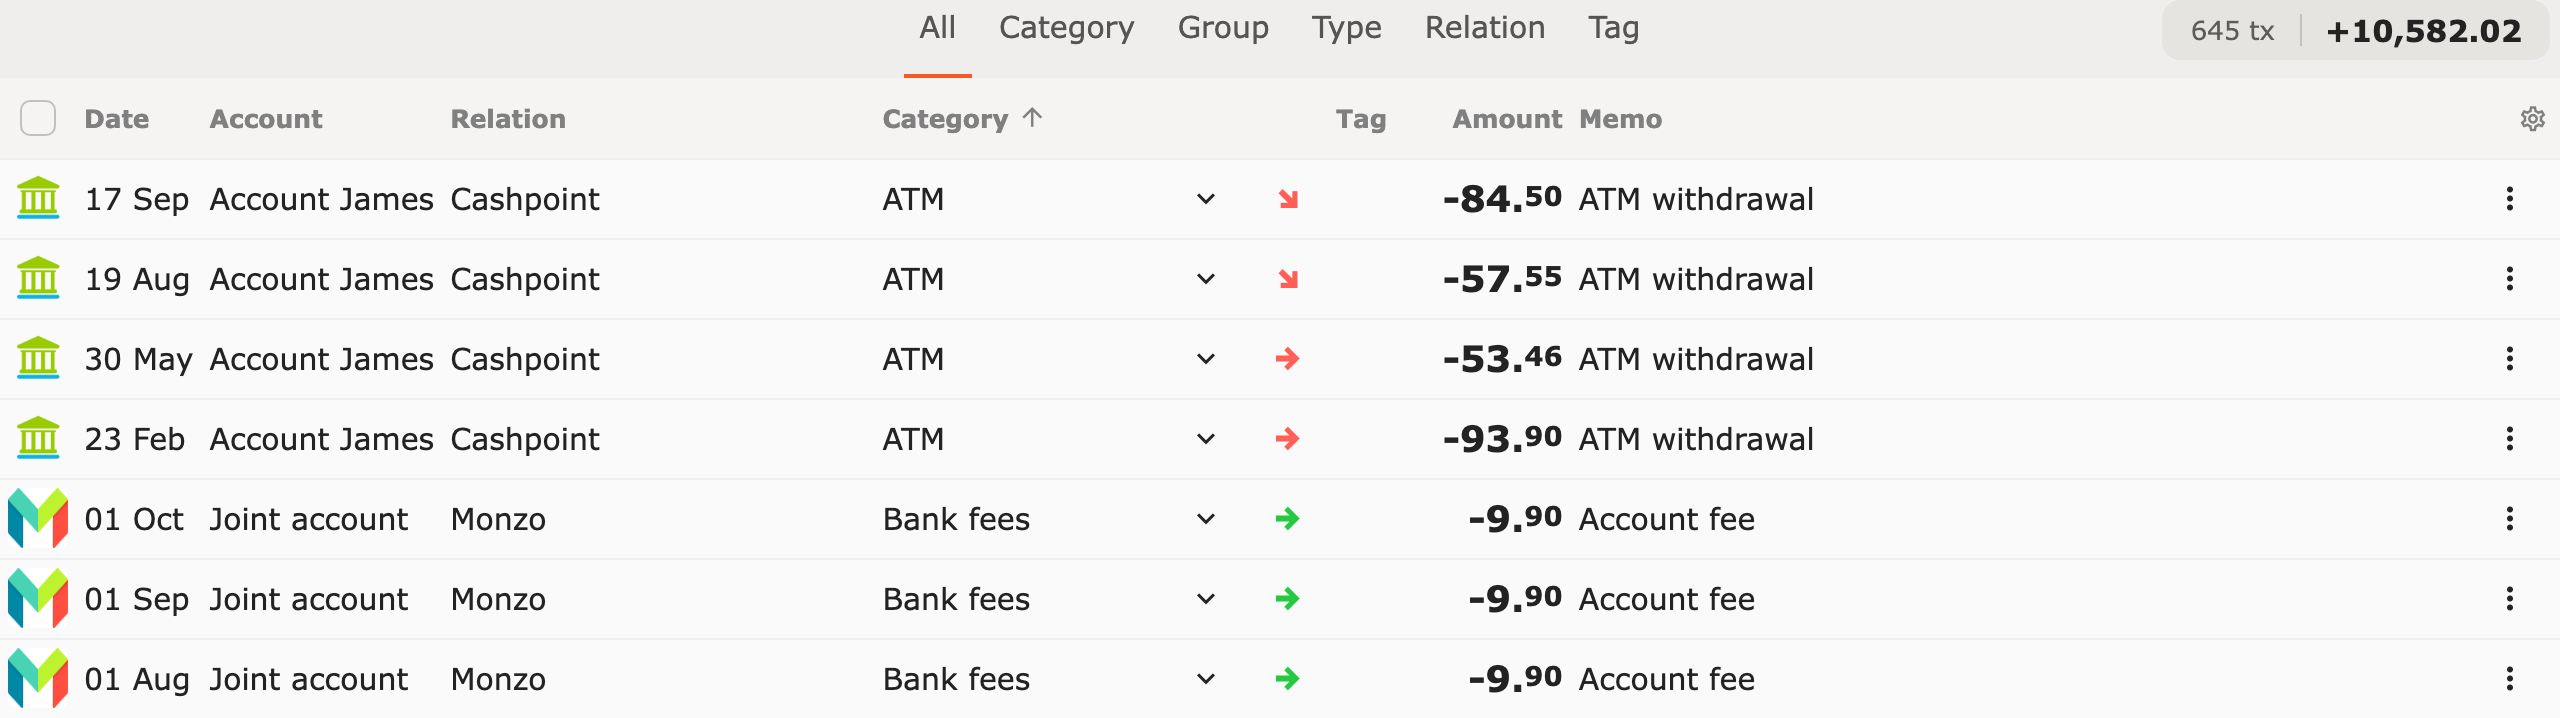
The Transactions tab is where most time is spent. All transactions from all accounts appear in a single list. Each row shows date, description, category, amount and balance, and the list can be searched, filtered and edited.
Screen layout
Section titled “Screen layout”- Top bar — period picker, search button, filter and actions menu.
- Tabs — filter by All, Category, Assign, Group, Type, Relation or Tag.
- Transaction list — each row is a transaction. Click it to open details.
- Chart (optional) — shows totals or the trend over time for the selected transactions. Toggle on/off via the chart icon at the top left. See Chart view.
- Column headers — above the list, on a wider screen. See Column headers.
Interacting with a transaction row
Section titled “Interacting with a transaction row”- Click the category to change or assign it.
- Click the transaction row to open the transaction details.
- Click the trend arrow or info icon to the right of the category for category details and statistics.
- Trend arrow gives a quick indication of category status: green = on/within budget, red = over budget; the arrow direction (up/down/right) indicates improvement, deterioration or on track. A short explanation appears on mouseover.
Selection
Section titled “Selection”Click the logo circle to the left of a transaction to show the checkbox column and check that row. The checkbox in the column headers selects all transactions in the list. If everything is already checked, the same checkbox unchecks them all again. See Edit multiple transactions at once.

Column headers
Section titled “Column headers”On a screen from about tablet width upward, a row of column headers appears above the list. On a narrow screen, or when the window has been narrowed, the column headers are not shown. The header row stays at the top while scrolling and shows the same columns as the list, as set in Column display. The gear icon on the right of the header row opens Column display.
Click a column header to sort by that column:
- Date — toggles between newest and oldest first.
- Amount, Relation, Category, Account and Tag — first click: largest amount first or A to Z. Second click: the other direction. Third click: sorting off, back to date.
A small arrow next to the column header shows which column is sorted. See also Sorting.
Balance column
Section titled “Balance column”A calculated balance is shown per row at that point in time. More details in Column display.
Finding something quickly
Section titled “Finding something quickly”- Search — click the magnifying glass and type a word from the description, counterparty or category. Space acts as AND, comma as OR (see Search operators).
- Filter — click the filter icon to filter by account, date, category, relation or amount.
- Period picker — the current year is shown at the top. Click it to select a month, quarter or a custom period.
- Account or profile filter — at the top right, filter by a single account or by a profile (a collection of accounts).

Chart view
Section titled “Chart view”A chart is available at the top of the screen. It shows totals or the trend over time for the selected and filtered transactions. Five types are available; each icon shows a short description on mouseover. On a narrow screen, select the type from a dropdown list.
- Total — distribution of the totals within the current period.
- Period — income, expenses and result per period as bars.
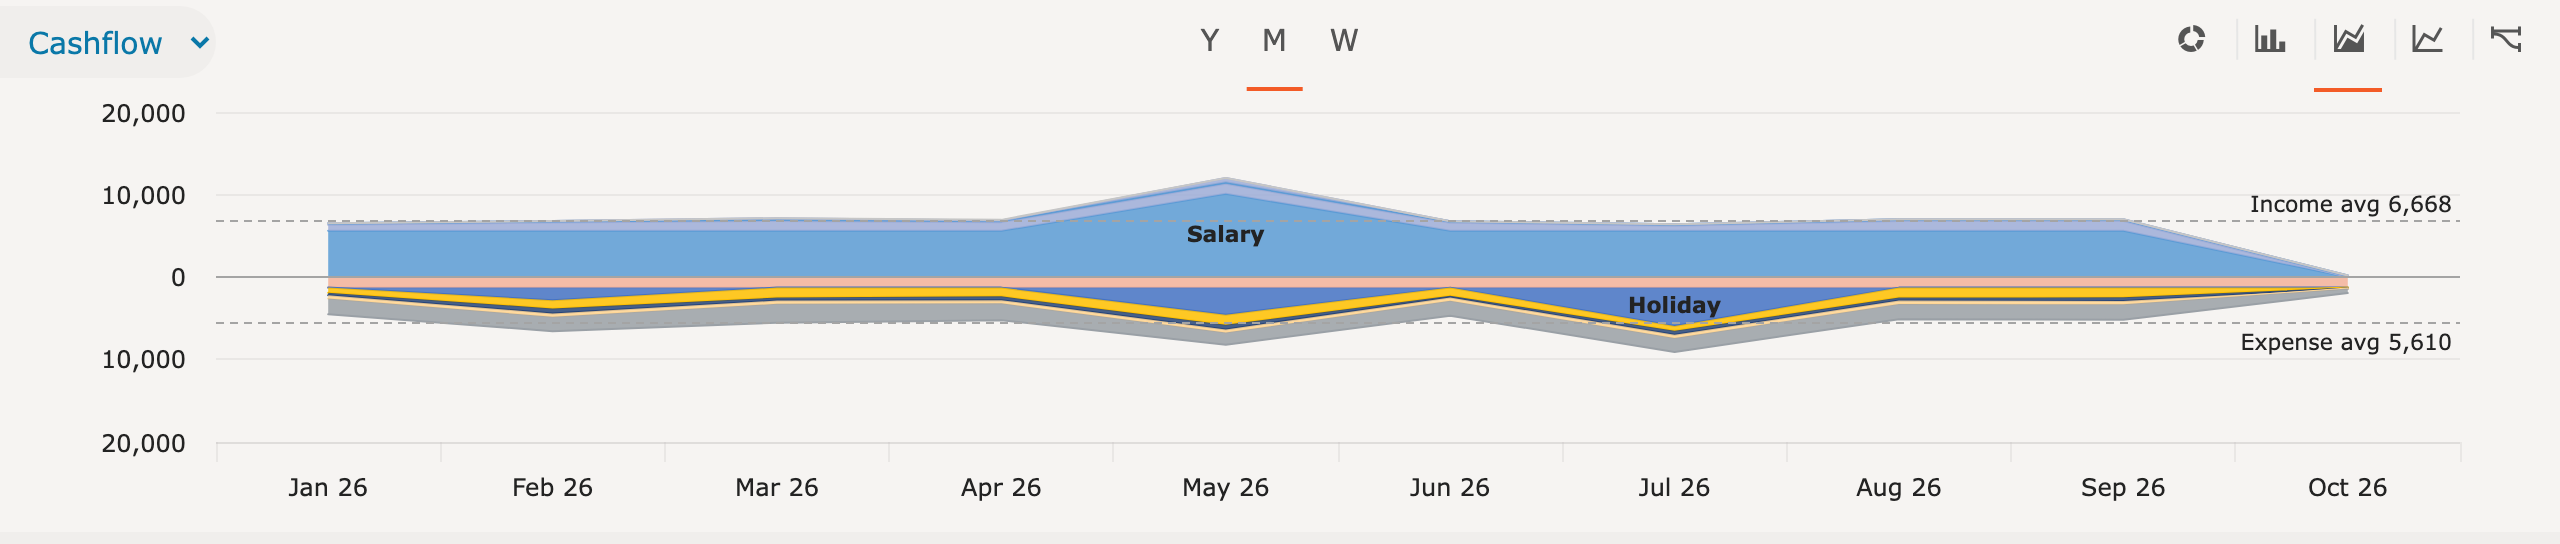
- Area — the trend over time per category, group, type, relation or tag, depending on the tab below the chart. Income appears above the zero line, expenses below it. Each side gets its own area for the five largest; the rest is grouped under Other. A dotted line shows the average per period.
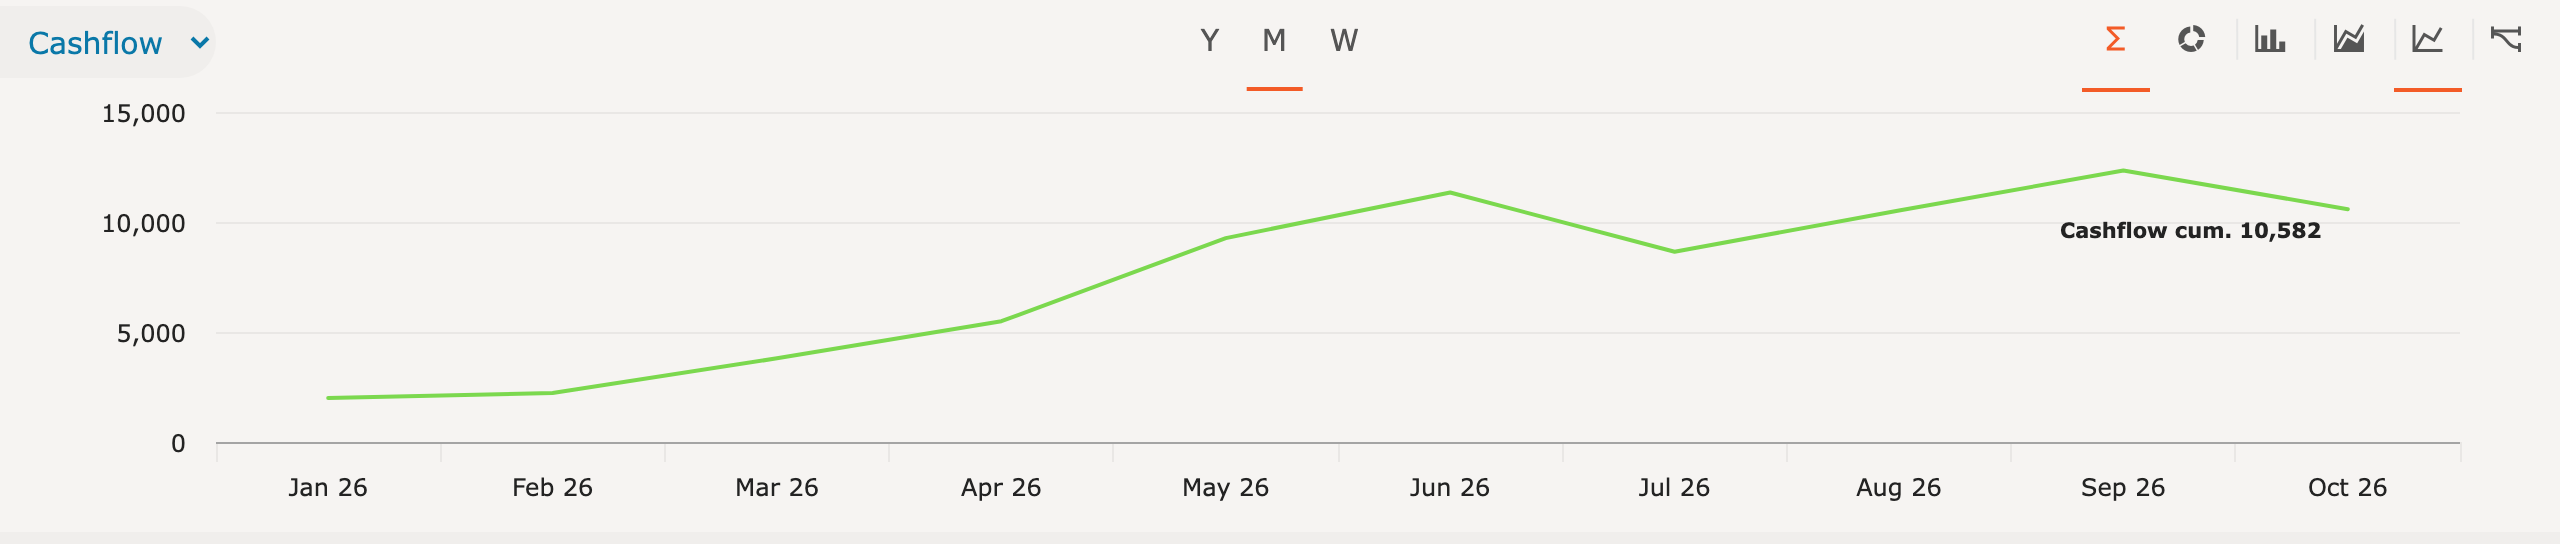
- Line — the result per period. The Σ button next to it switches to the cumulative result over the whole period. This choice is remembered per device.
- Flow (Sankey) — all money flows between categories, for an overall picture of where money comes from and goes to. See Flow diagram.
For Period, Area and Line, select the step for the time axis: per year (Y), month (M) or week (W). Period also has T for a single total. If only expenses are selected, for example with a filter on expenses, Area and Line show them as positive amounts.
At the top left, choose between Cashflow (including internal transfers) and Result (excluding internal transfers).

Which screen for which task?
Section titled “Which screen for which task?”Spendle has three screens with partly overlapping information, each with its own focus:
- Transactions — view, categorize, split and filter individual transactions, and add attachments.
- Dashboard — overview of the total financial picture: cashflow, balances, net worth over time.
- Insight — analysis per category or group over a period, with budget position and forecast.