

Cashflow diagram
The cashflow diagram shows money flows as a Sankey diagram: income, expenses, and internal transfers appear as flows whose width corresponds to the amount.
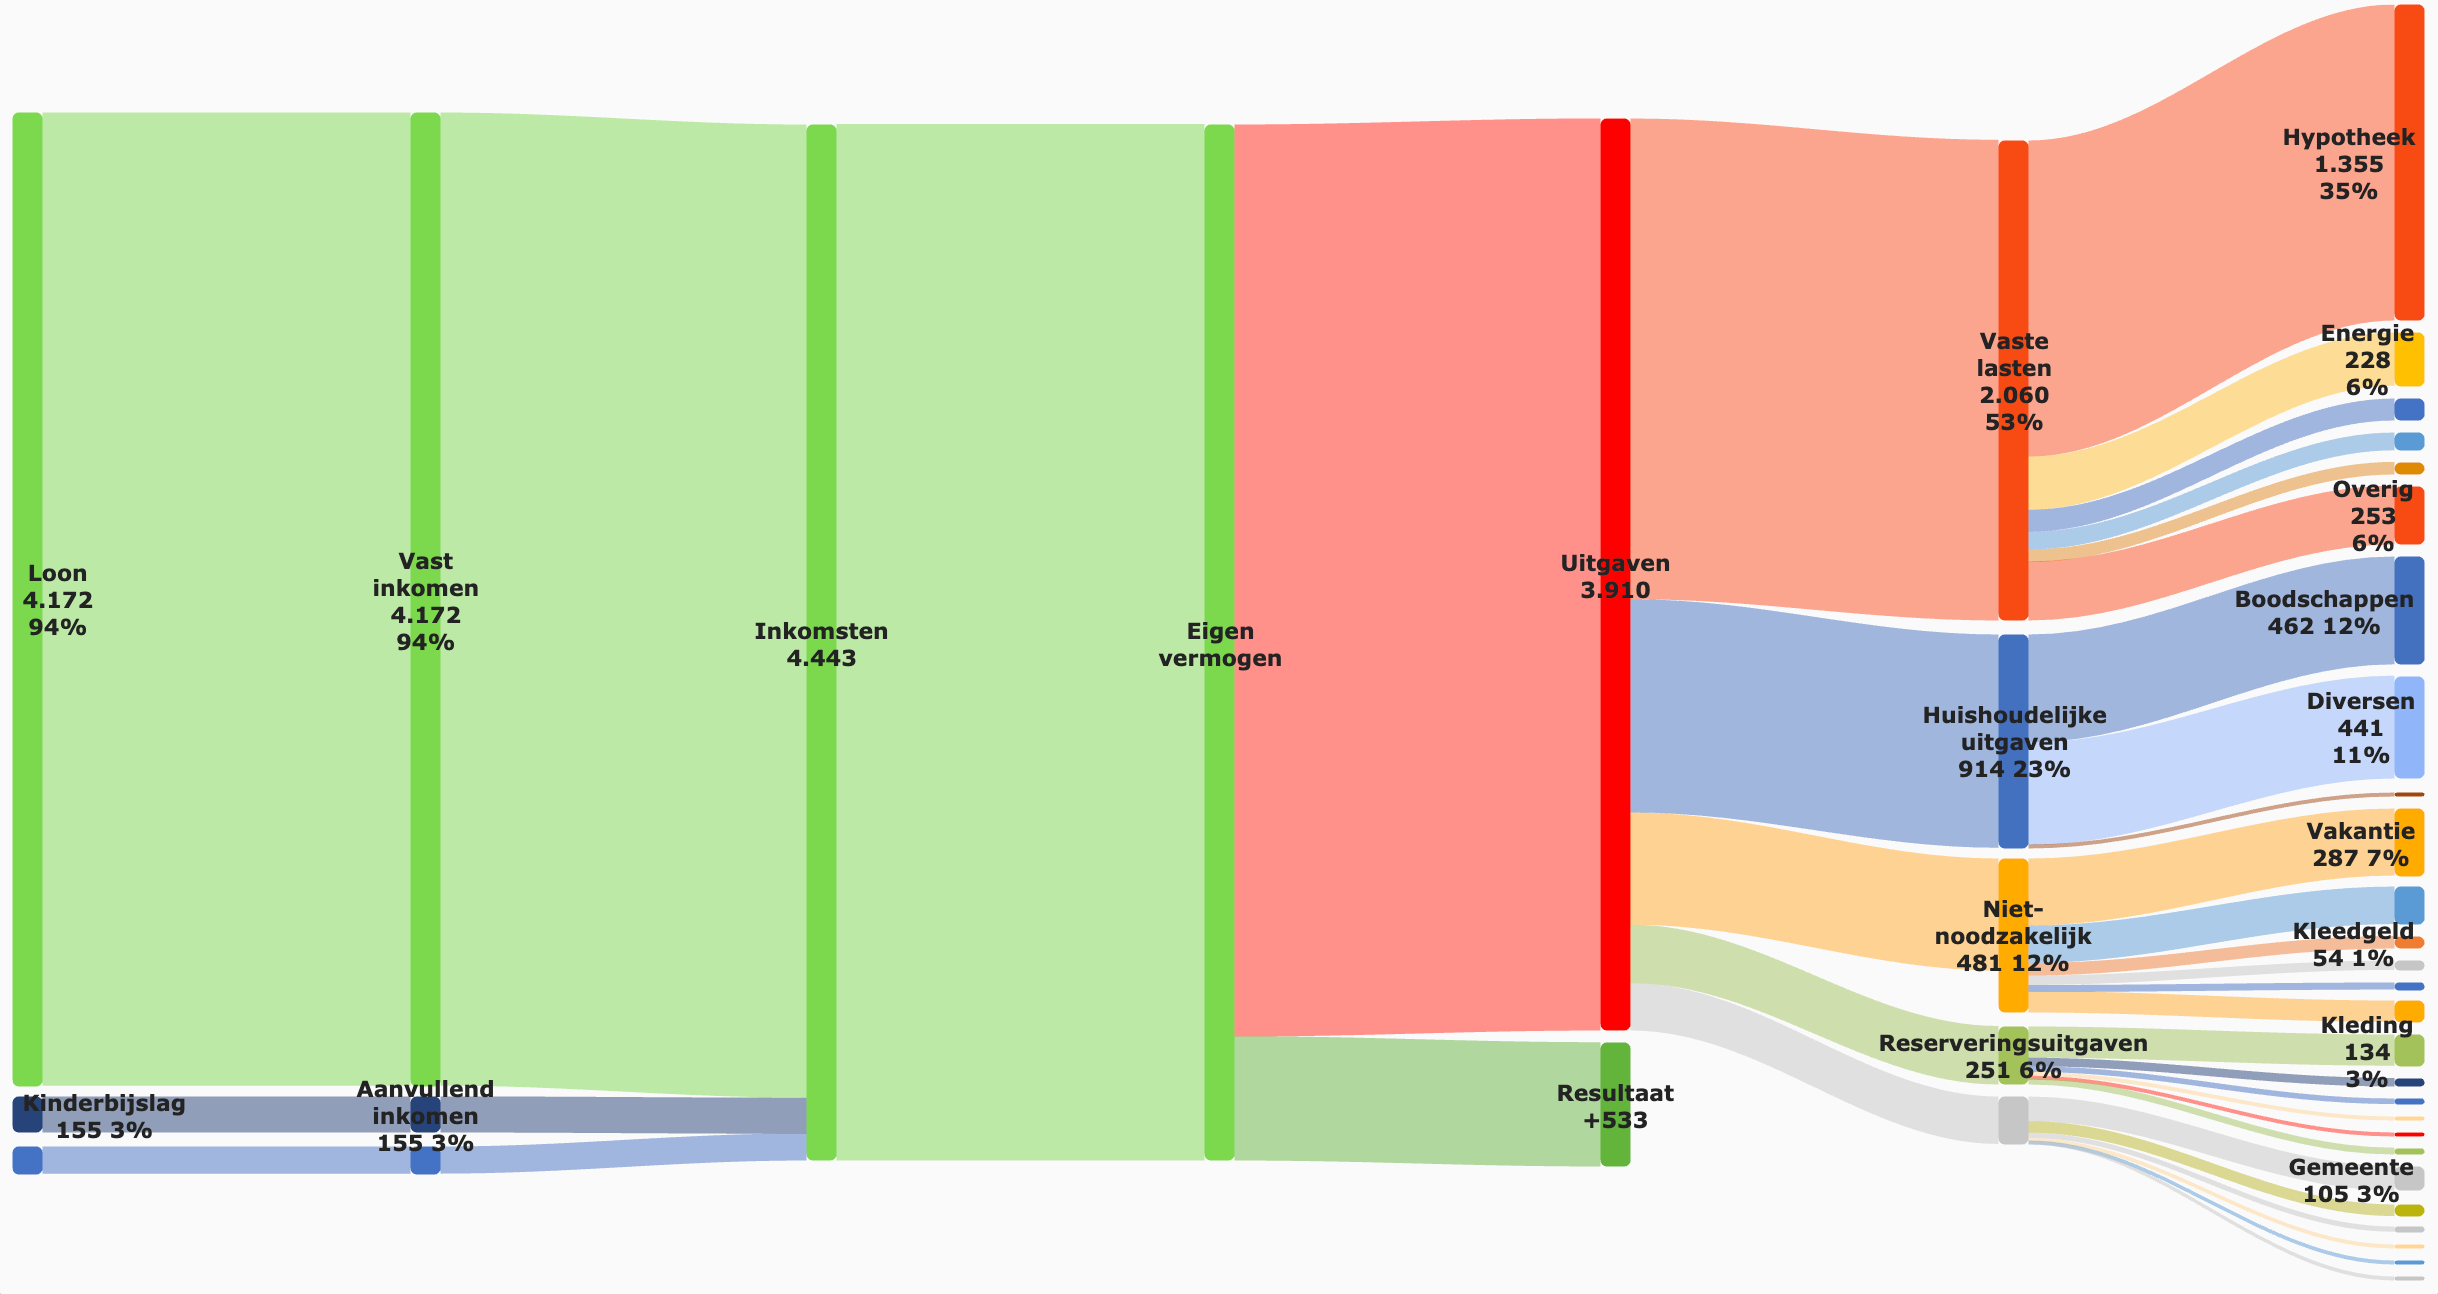
Where to find it
Section titled “Where to find it”Open the Transactions screen, open the chart, and select Flow from the chart-type buttons. Use Advanced to open a larger view.
Cashflow or Result
Section titled “Cashflow or Result”In the advanced view, switch between the following via a dropdown:
- Cashflow — all money flows, including transfers between accounts.
- Result — income and expenses only, without internal transfers.
Period
Section titled “Period”The period can be changed per month or per year.
Interaction
Section titled “Interaction”Click on a category to open the details. On mobile, a double-tap is required to prevent accidental filtering. From the category details, the budget can be adjusted directly. The diagram updates automatically.